Reports and sharing
How to create energy reports
Reports use the selected station's timezone and either your saved billing cycle start day or an exact custom date range. Energy results stay on the report screen; there is no spreadsheet download.
6 minute readLast reviewed August 20, 2026
Choose a report and period
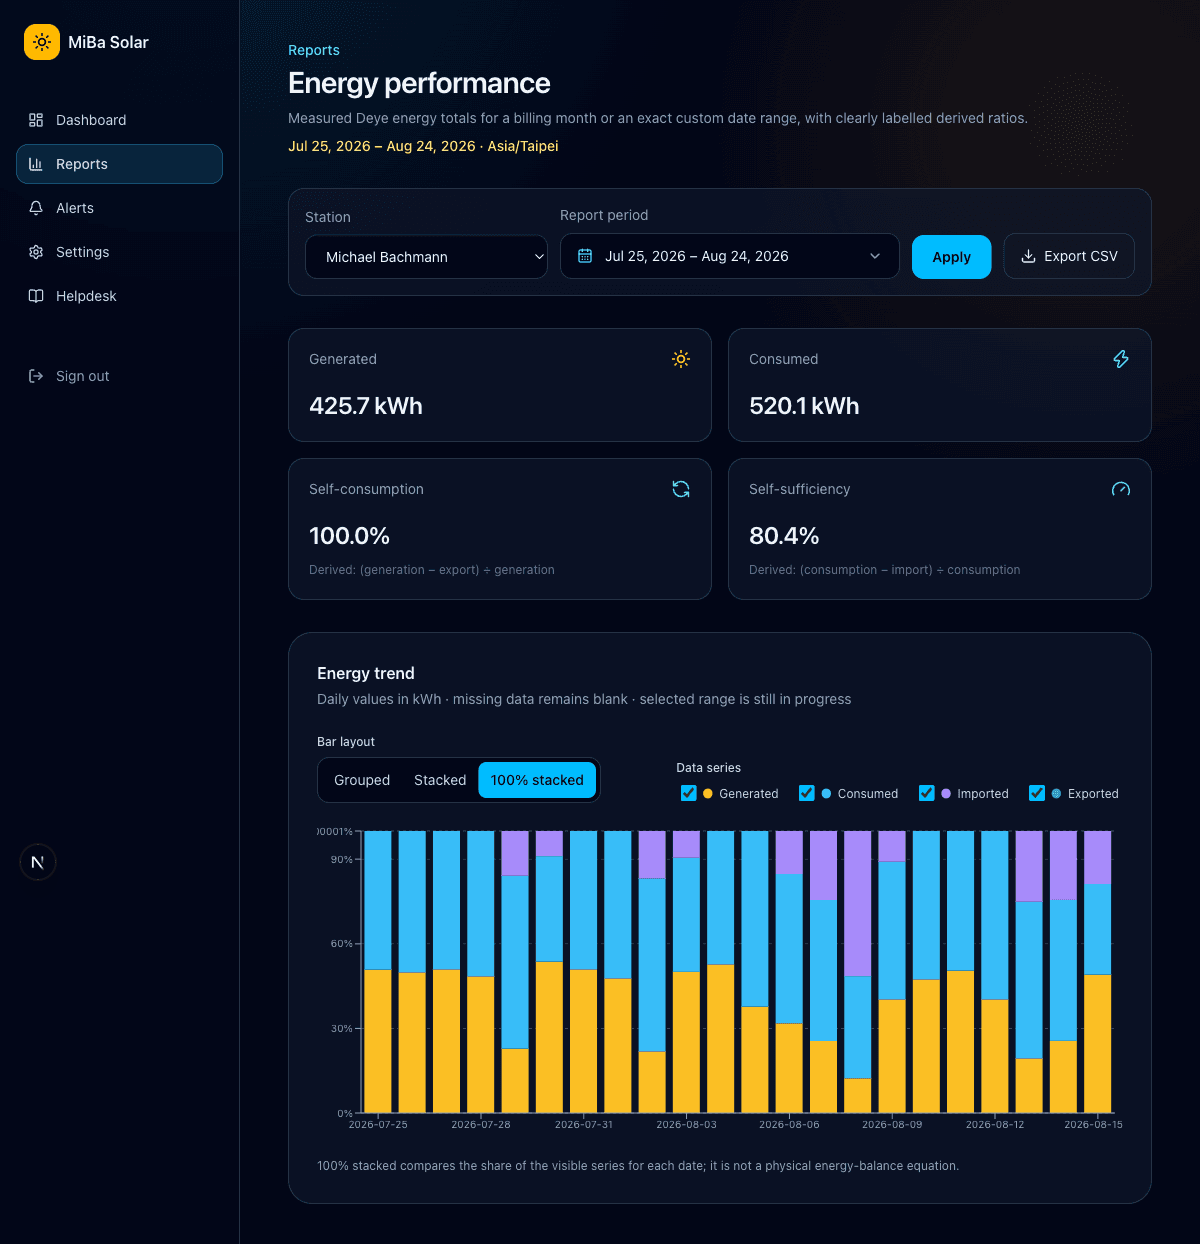
Use Reports for energy totals and trends. The page supports a selected billing month and an exact custom date range. Choosing a month or finishing both custom dates loads the report. The station list appears only when the account has more than one station.
Billing month versus custom dates
- Billing month
- Uses your saved cycle start day in the selected station's timezone. With start day 26, a cycle covers the 26th through the 25th. Start days 29–31 clamp to the final valid day of shorter months.
- Custom date
- Uses the exact inclusive start and end dates you choose, up to one year. It ignores the billing cycle start setting.
Read the result
- Confirm the station, period, timezone, units, and generation time before using totals.
- Check completeness. Missing or partial source data is not silently replaced with zero.
- The Battery charged | discharged card sums daily battery energy for the selected period. Nonzero discharged energy is shown with a negative sign, matching Dashboard Today.
- Previous-period comparisons require equivalent compatible data.
- Self-consumption and self-sufficiency appear only when their required inputs and denominators are valid. An enabled report export-credit multiplier also requires complete Grid export data.
- The private Deye-based estimate shows import and export separately, plus a rate-equivalent net import/credit that is not an invoice kWh line. Settings keeps your pair as Default energy rates and lets you save complete monthly historical overrides. A historical month matches the report billing cycle (from your cycle start day through the day before the next cycle) and does not overlap the next saved month. When a historical override priced the period, the estimate shows that rate and states that a historical rate has been applied; it does not say that multiple monthly rates were applied. The estimate sums daily import charges minus export credits and preserves a negative result when export credit exceeds import cost. It works for a billing cycle in progress using all queried days through now. Utility-meter differences, prior or carried credits, fixed adjustments, taxes, tiering, time-of-use pricing, and other invoice items are excluded, so the estimate is not the amount due or a promised cash payment. Changing currency changes the label for all saved rates without converting their numeric values.
- Use Grouped for side-by-side kWh, Stacked for one shared kWh stack, or 100% stacked to compare the share of the visible series. The 100% view is not a physical energy-balance equation.
- Use the Generated, Consumed, Imported, and Exported checkboxes to show or hide chart series without changing the summary totals.
- On signed-in Energy Reports, series choices stay saved in this browser and on this device across visits.
- Hover, tap or drag horizontally, or use the chart's arrow-key navigation to inspect a date. Its values appear above the bars so the plot stays visible; 100% stacked keeps both the percentage and original kWh.
Reports stay on screen
MiBa Solar does not offer CSV or another file download. Use the Energy Performance screen for the selected period.
- Public share links can show the same reports but remain read-only.
- Public views do not include Settings, a station selector, private billing preferences, or energy-charge estimates.
- Grid import and Grid export remain visible in public reports, but the owner's export-credit multiplier, rates, currency, and energy-charge estimate stay private.