Understand your data
How to read the MiBa Solar dashboard
Start with the source-time label and selected period, then read each card using its unit. Live shows current power; Today and calendar dates show energy accumulated over a station-local day.
Dashboard overview
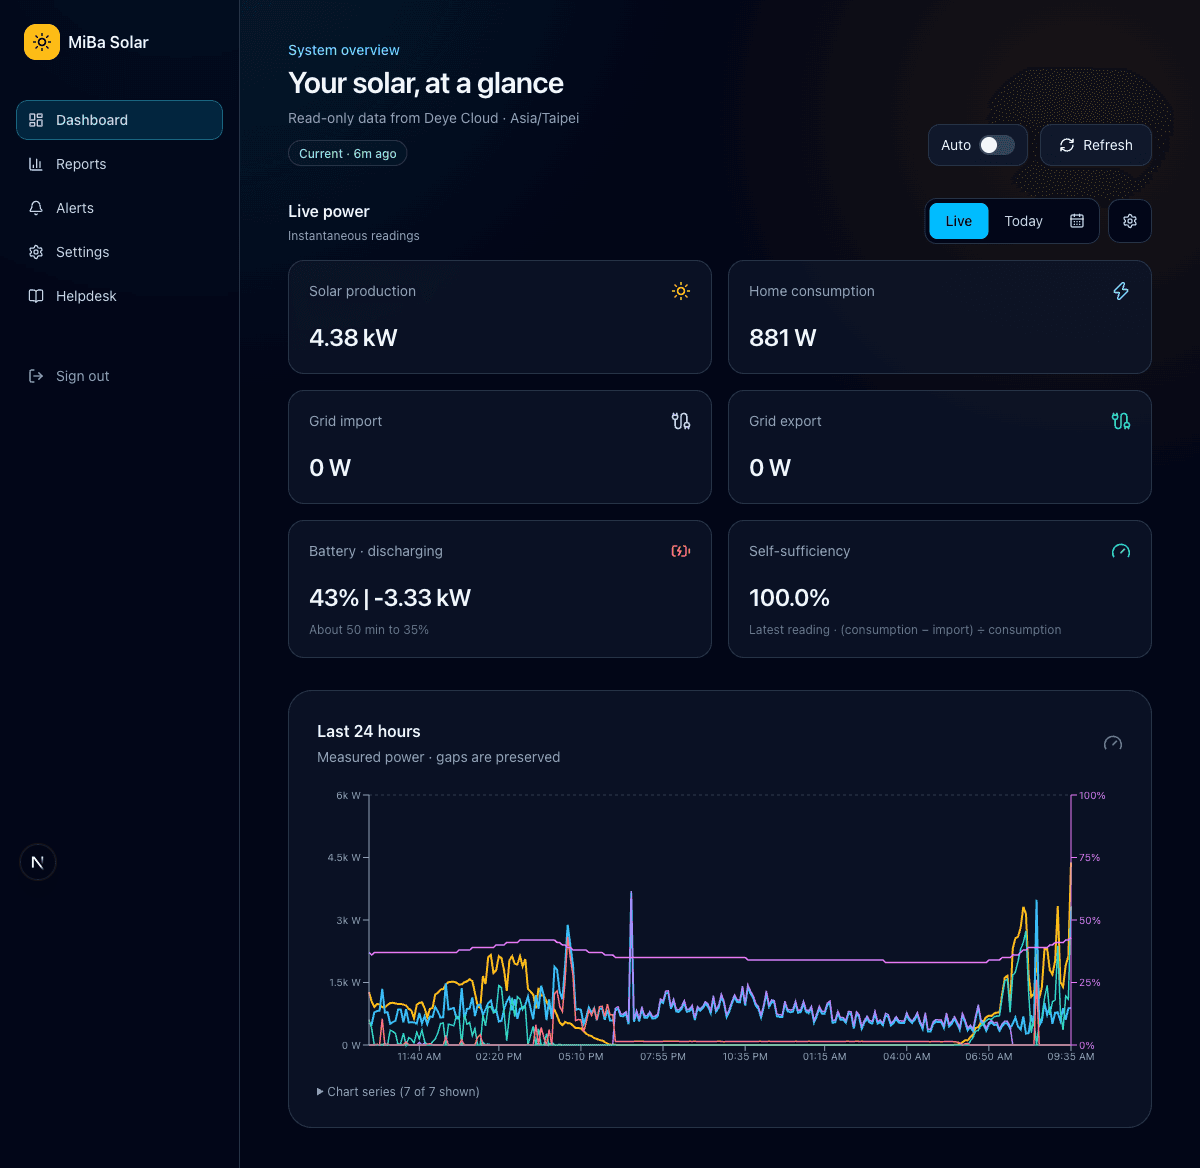
The dashboard groups the selected station, data freshness, period controls, supported metric cards, and intraday power chart into one monitoring view. The source reading time is more important than the time the web page happened to load.
Choose the correct period
- Live
- Shows the latest instantaneous power readings in W or kW, battery SOC, and a latest-reading self-sufficiency value when its inputs are complete.
- Today
- Shows energy accumulated since midnight in the selected station's timezone, measured in Wh or kWh, plus that day's intraday power chart.
- Calendar date
- Shows the daily energy totals and intraday samples for one validated past station-local date. The date remains in the URL for refresh and sharing within your authenticated session.
Read the source time before values
- Data as of shows the source reading time in your saved display timezone, or the selected station's timezone when you use the automatic default. The label includes its timezone abbreviation and adds the date when needed.
- Display timezone changes only how signed-in dates and times are shown. Today, calendar dates, reports, and public share views keep the selected station's timezone.
- Stale means the last known values are still displayed but should not be treated as current.
- Offline describes a system reporting state and is different from a MiBa Solar or Deye API error.
- Partial means some expected readings or samples are missing. Charts preserve those gaps.
- Not available or unsupported means the selected system did not provide enough evidence for that metric.
Refresh and Auto behavior
A repeat visit shows the latest validated station-and-period snapshot immediately. MiBa Solar normally checks seven minutes after the source reading: five minutes for the expected update and two minutes for publication. If the reading remains unchanged, checks wait 30 seconds during the next three minutes, then two minutes until newer data arrives. Refresh shows the same remaining countdown for manual checks, Auto, and live power flow. Missing source times use two-minute spacing; request errors use a separate retry delay.
Auto is available only in Live and always starts off. Enabling it waits for the same freshness-aware countdown instead of forcing a request. Hidden tabs pause polling and perform at most one due catch-up refresh when shown again.
Work-mode reserve shading
MiBa Solar reads the schedule once when you first open Dashboard or Settings. View the saved reserve thresholds in Settings → Battery & schedule → Work-mode schedule. If you change them on the inverter, select Read from inverter to update them. Solar can charge above these reserves; they are not charging ceilings.
Shade work-mode reserve overlays the saved thresholds on your private Dashboard chart. Your on/off choice stays in this browser. A selected past date compares against the saved schedule, not historical inverter settings. View schedule returns to Settings.
In Settings → Battery & schedule → Battery reserve, enable Use work-mode schedule for time remaining to estimate when discharge will first stop at a scheduled reserve. This account setting saves automatically. Turning it off uses your fixed Low battery percentage. Charging still estimates time to 100%.
The same reserve periods apply every day. Shading is unavailable when the schedule is disabled, the last read failed, or the inverter has changed. A failed reread keeps the previous table and its original Last read time. Reconnect if asked, or wait for the displayed retry countdown.
Dashboard cards
Every supported dashboard card is shown automatically. Use the chart legend to inspect individual chart series.
On your signed-in Dashboard, chart line choices stay saved in this browser and on this device across visits; each metric chart has its own choices.
Tap or click a visible metric card to open that metric's rolling line chart. The dialog starts on the past 24 hours and can switch to 3 days or 7 days without leaving the card. The chart is still instantaneous power (or irradiance / battery state of charge), even when the dashboard cards show Today or a selected day's energy. Self-sufficiency is not a chart. Public share links offer the same read-only drill-in without changing owner settings.
To inspect the intraday chart without hiding the graph, hover a point, tap or drag horizontally, or focus the chart and use the arrow keys. The selected time and values appear in the panel above the plot.
You can also zoom into a time window. Pinch with two fingers or two-finger drag to pan on touch devices, use the mouse wheel or drag on desktop, double-tap to zoom in, and drag the Pan slider that appears below the chart while zoomed. One finger always scrolls the page normally, and the plus, minus, and Reset buttons above the chart work on every device. Zooming is temporary and resets when you leave the page.